Van Westendorp accuracy: why the price it gives you is probably wrong
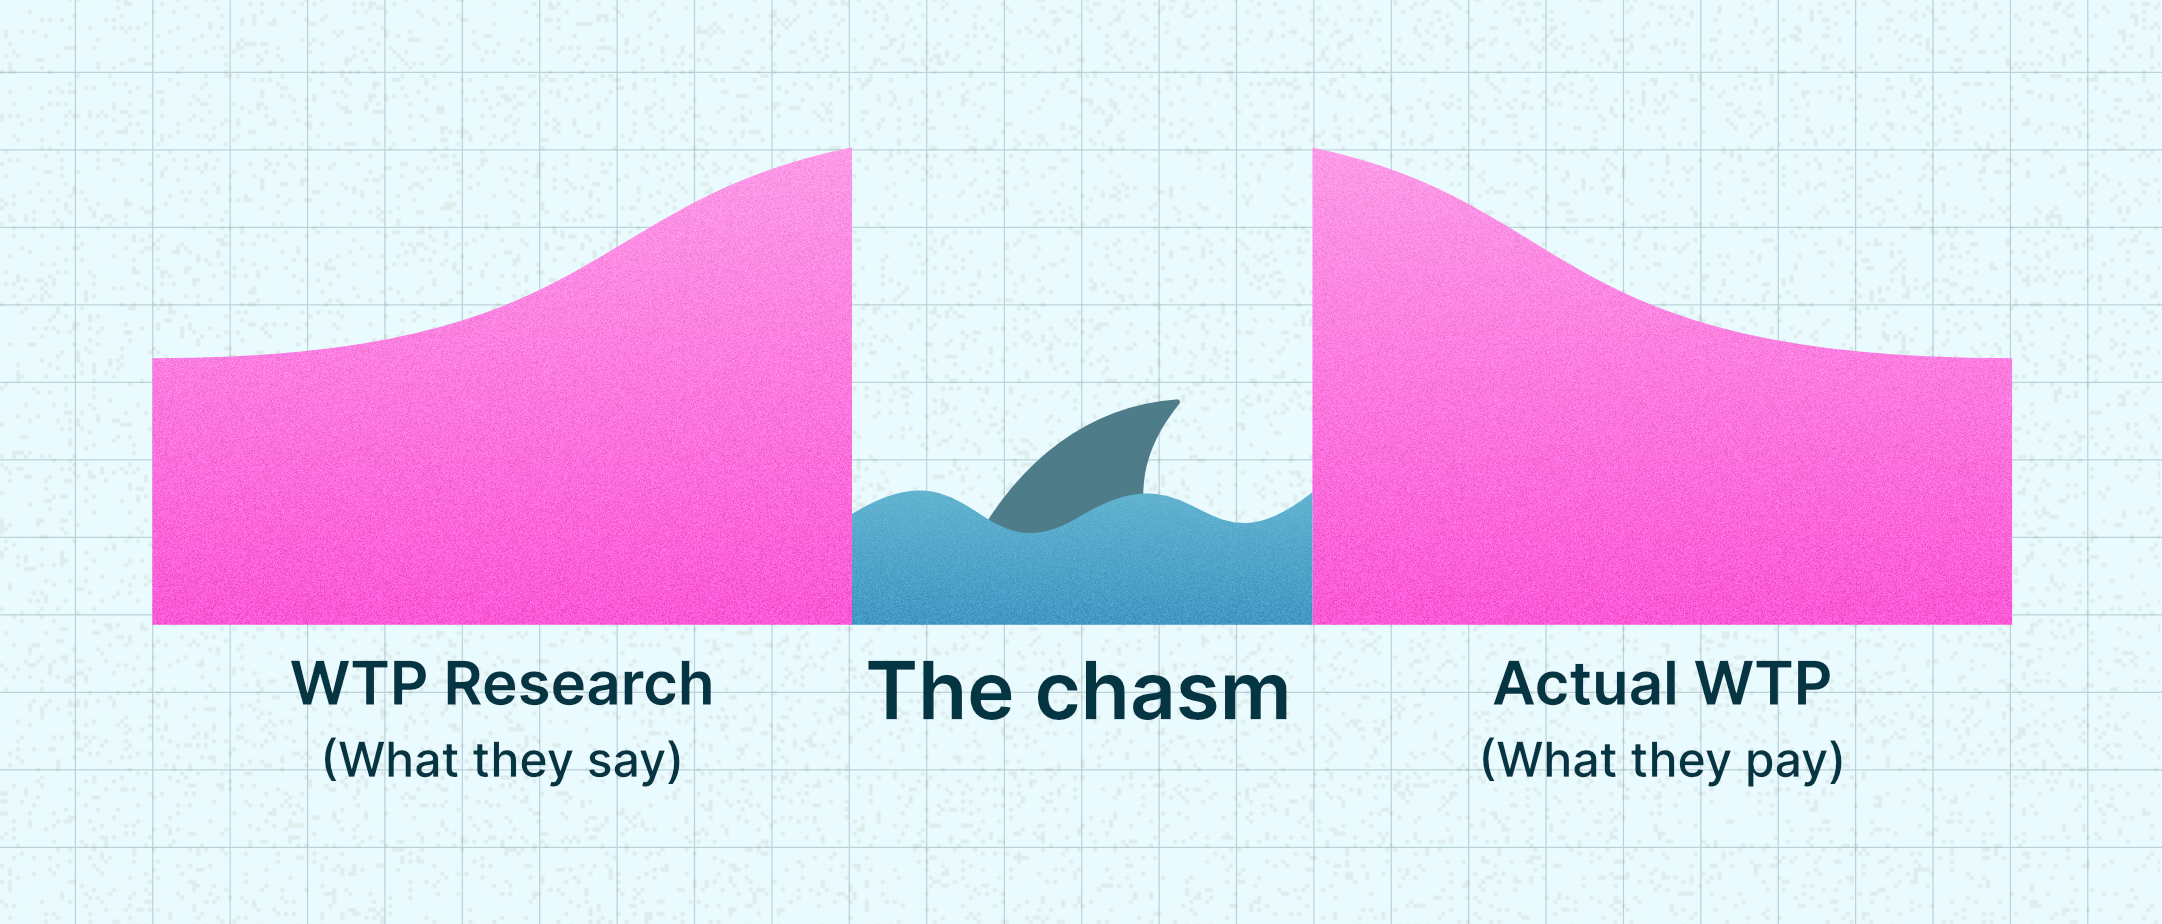
Most willingness-to-pay research I’ve seen is useless.
There’s a chasm between saying what you’d pay and swiping a credit card. Answering a survey costs you nothing. Buying something costs you money you could have spent elsewhere, plus the meeting where you explain to finance why you spent it.
I’ve watched a Van Westendorp come back with an optimal price roughly 50% below what the market was already paying without complaint. Not off by a predictable multiple. Off in the wrong direction entirely.
That’s the part most critiques of pricing research miss. Everyone accepts that survey answers drift from real behavior. The assumption is that they drift one way, so you apply a haircut and move on. They don’t. The number is wrong and you can’t tell which way.
That makes it worse than having no number, because if you have no predictions you at least know your price isn’t optimal, pricing research gives you fake confidence.
What the Van Westendorp price sensitivity meter actually measures
Four questions and a chart
The Van Westendorp price sensitivity meter asks respondents four questions about a product: at what price is it too expensive to consider, at what price is it getting expensive but still worth considering, at what price is it a bargain, and at what price is it so cheap you’d question the quality.
Plot the cumulative curves, find where they cross, and you get an acceptable price range plus a point the method calls optimal. Peter van Westendorp introduced it in 1976. It survives because it takes twenty minutes to field and produces something that looks like an answer.
Where to use pricing research
Ranking. If you want to know whether buyers value the audit log more than the SSO integration, or which features belong in which tier, survey methods work. Conjoint and MaxDiff are good at this and I use them. Relative preference is something people can report accurately, because comparing two things is a judgment they make all the time.
What people use it for instead
Setting a price. The chart hands you a number, the number goes in a deck, and three weeks later it’s on the pricing page.
That leap is where the method breaks. Ranking answers and payment answers come from different places, which is the whole subject of this article.
How accurate is Van Westendorp?
What the meta-analyses say
Across hundreds of studies, hypothetical valuations come in around 1.2 to 1.4 times what people actually pay. Mahr and colleagues (2020) pooled 77 studies across 47 papers, covering 24,347 hypothetical and 20,656 real observations, and found hypothetical methods overshoot by about 21% on average. Murphy and colleagues (2005), looking at 28 stated-preference studies, found a median ratio of 1.35 with heavy positive skew.
Worth reading that second paper carefully, because it argues against the folk wisdom in both directions. People assume surveys overstate by a factor of two or three. The measured median is 1.35.
Wider ranges show up outside consumer goods. A 2019 systematic review in Social Science and Medicine found hypothetical willingness to pay averaging 3.2 times actual across contingent valuation studies, with a range running from 0.7 to 11.8. That lower bound matters. Some studies found people stating less than they actually paid.
What happens when someone tests Van Westendorp directly
Almost nobody has. That’s the first thing to know about Van Westendorp accuracy: the method is 50 years old, it’s used constantly, and the published validation is thin.
The main exception is Kloss and Kunter (2016), who ran a field experiment on Mozartkugel chocolate comparing three methods: contingent valuation, the incentive-aligned Becker-DeGroot-Marschak mechanism where respondents can actually end up buying, and the Van Westendorp price sensitivity meter.
Contingent valuation came out at €0.80 against BDM’s €0.41, roughly double, and the revenue-maximizing price it implied was 131% above the incentive-aligned estimate. Standard hypothetical bias.
Van Westendorp did better. Its optimal price point landed close to the BDM result.
I’m telling you this because it’s the strongest evidence against the argument I’m making, and you’ll find it if you go looking. What I’d point out is the authors’ own explanation. They attribute the good result to two biases cancelling: respondents overstate because nothing is at stake, and the method’s four questions pull answers down because they’re built around finding where price resistance starts rather than where value peaks. The paper still concludes that the price sensitivity meter produces biased results, and that its accuracy here may be an artifact.
Two errors that happen to offset on a 40-cent chocolate is not a property you can rely on. It’s a coincidence, and the odds it repeats on an annual contract with a procurement process attached are not something I’d price against.
Separately, Miller, Hofstetter, Krohmer and Zhang (2011) in the Journal of Marketing Research compared open-ended questioning, choice-based conjoint, BDM and incentive-aligned conjoint against real purchase data. The incentive-aligned methods passed. The hypothetical ones did not. Van Westendorp wasn’t in that comparison, but the mechanism that sank the hypothetical methods there is the same one operating here: no transaction, no constraint on the answer.
Almost all of that evidence is B2C
Chocolate. Consumer packaged goods. Environmental valuation studies about wetlands and air quality. Health economics. A person deciding on a small purchase with their own money, in a category they know.
There is close to nothing on B2B software willingness to pay. Every structural feature of a SaaS purchase is absent from the studies: the recurring commitment, the approval chain, the implementation cost, the fact that the money belongs to the company.
So when someone quotes you a bias figure for your pricing research, they’re extrapolating from chocolate. I’m citing those numbers anyway, because they’re the best evidence anyone has. Just don’t treat 21% as your correction factor.
Errors compound on the way to a price
Willingness to pay is an input. Price is derived from it. Errors don’t stay the same size on the way through.
That 131% figure from the chocolate study is the clearest illustration. A measurement roughly two times off produced a revenue-maximizing price wrong by considerably more than two times, because the optimal price falls out of a demand curve and the curve inherits every error in the inputs.
This is why “surveys are directionally useful” is a weaker defense than it sounds. Direction survives. Magnitude doesn’t, and magnitude is what goes on the pricing page.
Four reasons the number comes in too high
Nothing else is competing for the money
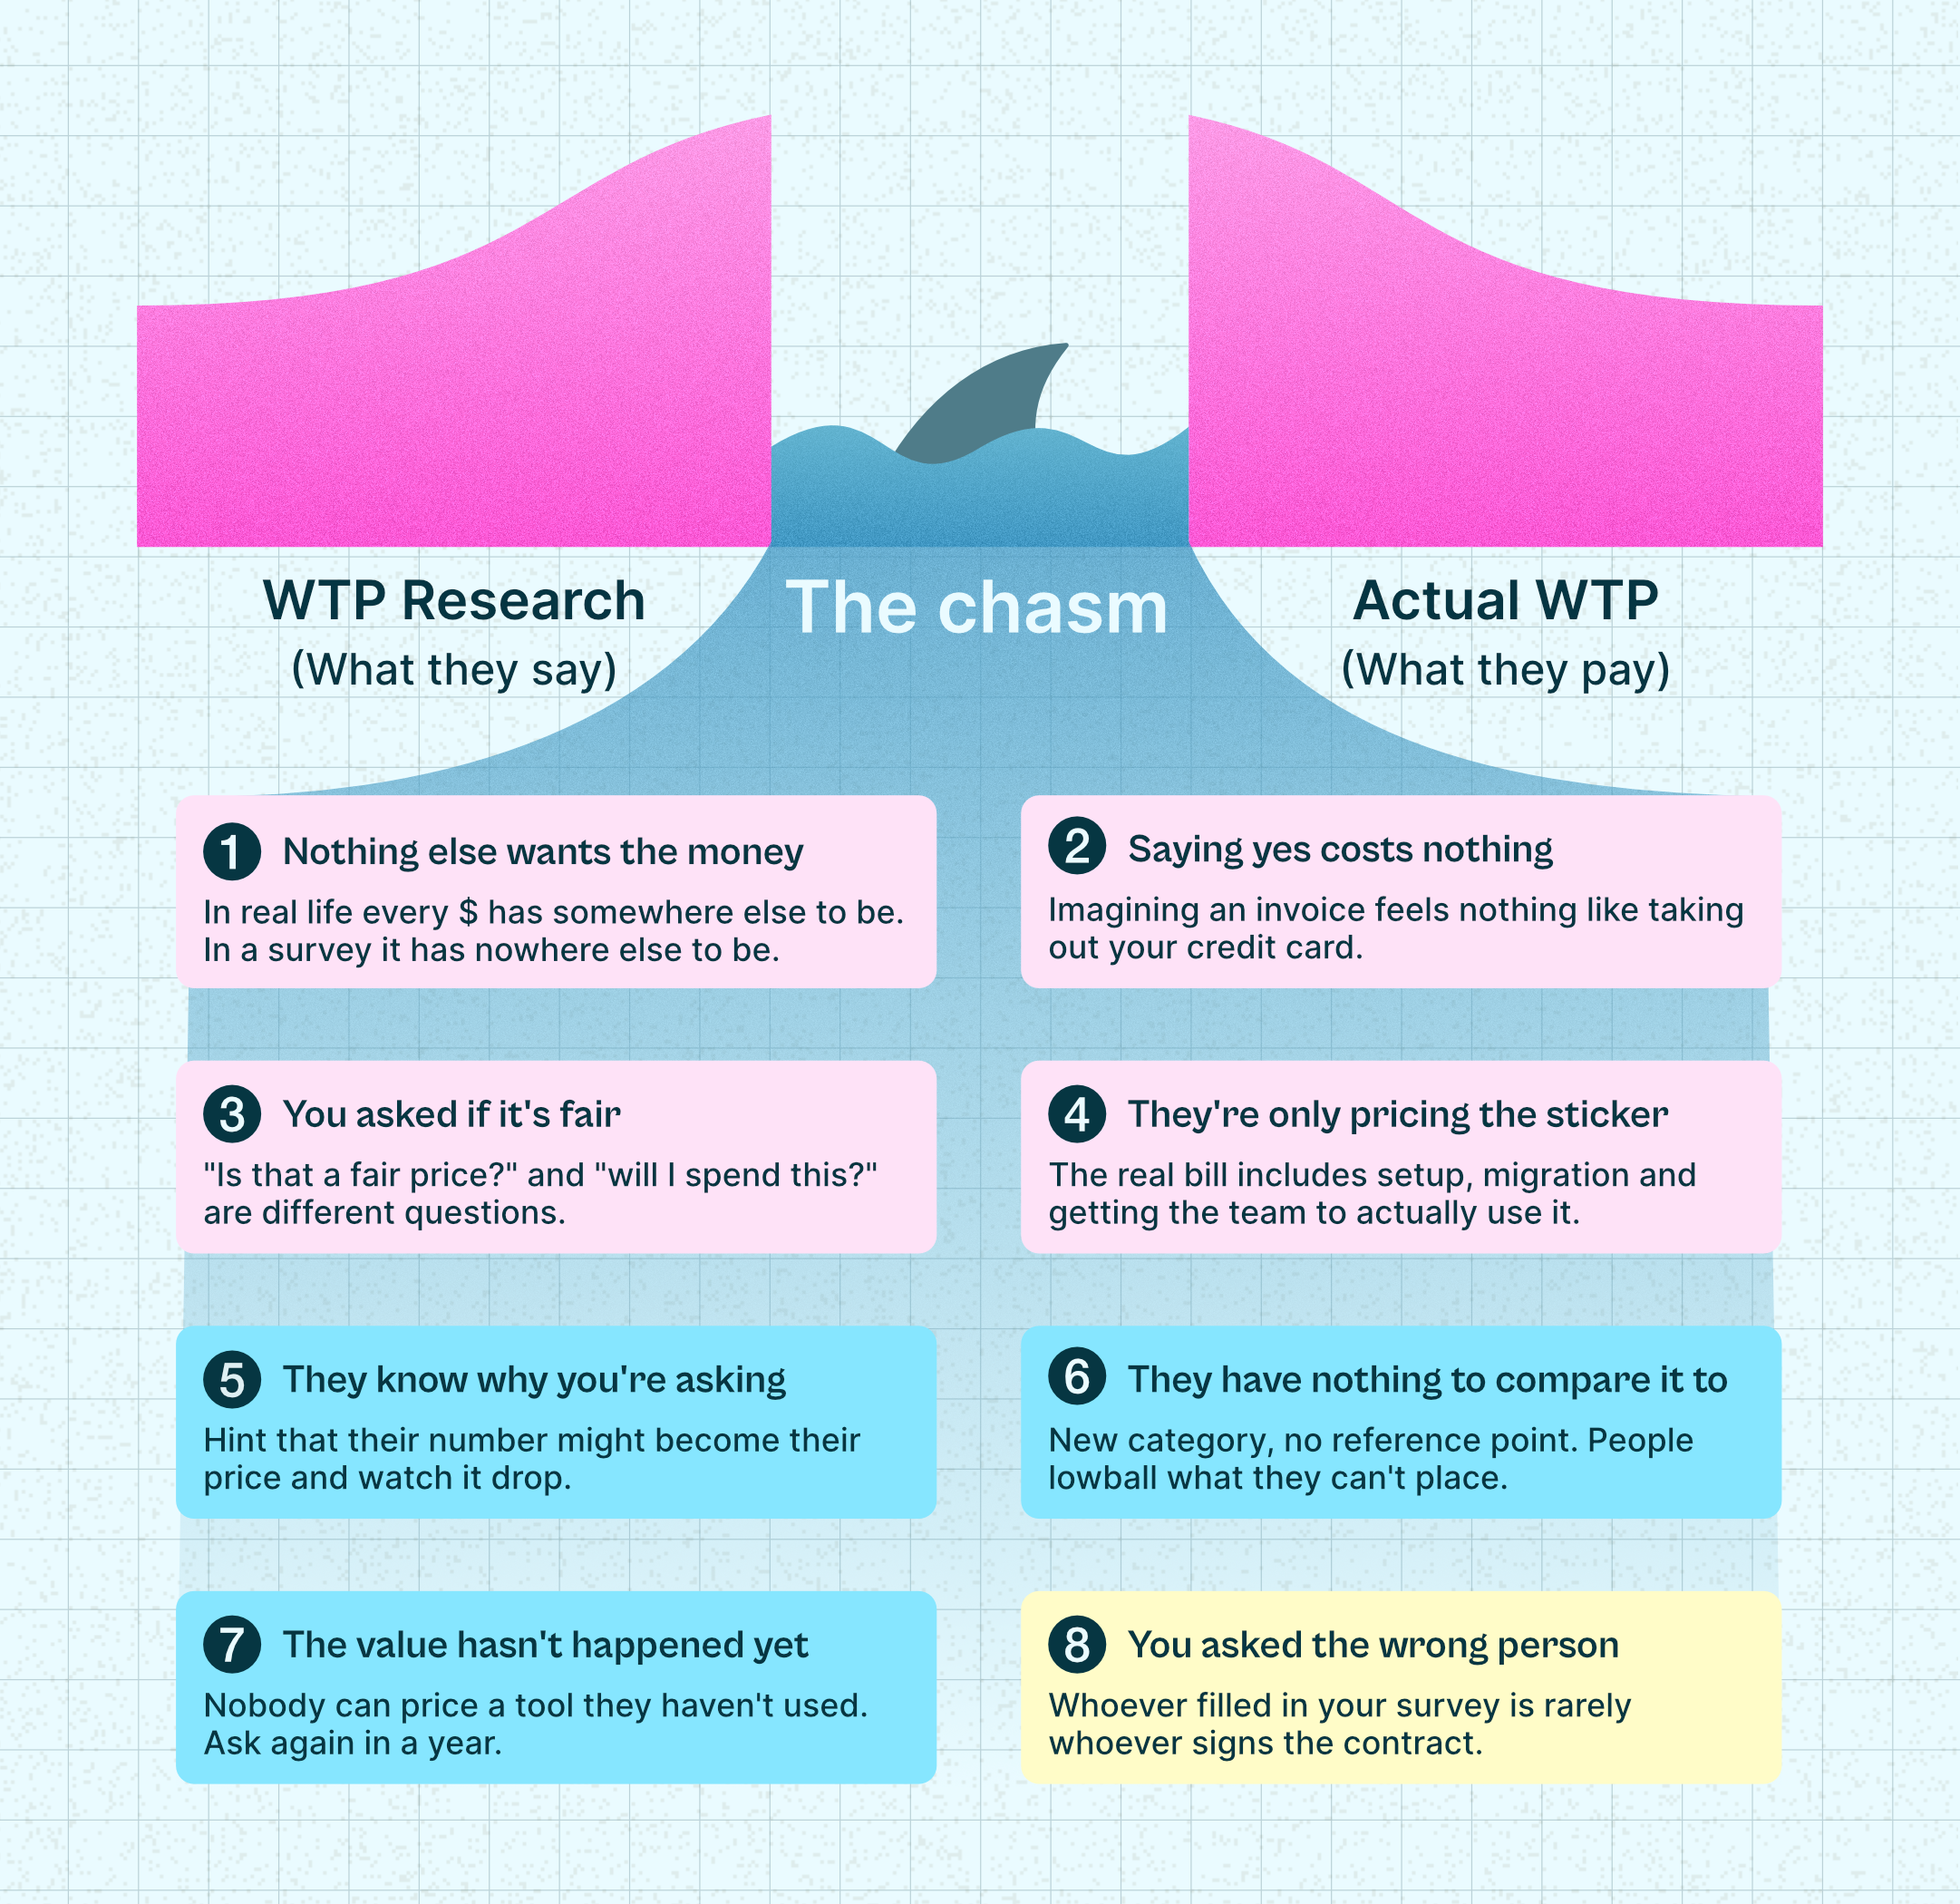
In real life, every dollar you spend is a dollar not spent on something else. In a survey it has nowhere else to be.
Frederick and colleagues showed in 2009 that people don’t spontaneously consider what else their money could buy. Prompt them to think about it and purchase likelihood drops measurably. Surveys never prompt it. Budgets always do.
In B2B this is sharper, because the competing use has a name. Your prospect isn’t weighing your product against an abstract sense of value. They’re weighing it against the other tool up for renewal in March and the contractor they wanted to hire.
Saying yes costs nothing
Imagining an invoice and approving one are different experiences. Prelec and Loewenstein called the second one the pain of paying, and neuroimaging work by Knutson and colleagues found that prices people consider excessive trigger an aversive response, one that predicts whether they buy.
A survey skips that entirely. You get the evaluation without the flinch.
You asked whether the price is fair, not whether they’d buy
“Is $200 a month reasonable for a tool like this?” is a question about the category. It asks whether the price is defensible against comparable products.
“Will you spend $200 a month on this?” is a question about a budget.
People answer the first one and you record it as an answer to the second. Both answers are honest. They’re answers to different questions.
They’re only pricing the sticker
Respondents price the subscription. Buyers pay for the subscription plus implementation, plus data migration, plus the three weeks where the team is slower because they’re learning it, plus the internal owner who now spends part of their job on your product.
The gap between sticker and total cost is wide in B2B and invisible in a survey. Ask about the sticker and you get a number that ignores the rest of the bill.
Three reasons the number comes in too low
They know what you’ll do with the answer
This is the one that never shows up in the consumer literature, and it’s the one I’ve seen bite hardest.
A shopper in a chocolate experiment has no stake in the researcher’s conclusions. Your customer does. Hint that the answers might inform your pricing and you’ve turned a research instrument into a negotiation. Lowballing becomes the rational move.
You’ll never hear from a customer that your prices are too low. That holds in surveys too.
They have nothing to compare it to
People price against reference points. Ask someone what a project management tool should cost and they’ll anchor on the ones they’ve used.
Remove the reference and the answer degrades. In genuinely new categories, buyers have nothing to anchor to, so they anchor low, often on the closest cheap thing they can think of. This is the biggest problem with AI pricing research right now. Half the products being priced have no established category, and the reference point buyers reach for is usually a $20 chat subscription.
Value hasn’t happened yet
Nobody can price a tool they haven’t used. Willingness to pay in month twelve is not knowable in month zero, and the gap between them is the entire product experience.
At Toggl we raised prices repeatedly over the years, and it worked every time, because the product kept getting more valuable to the people already using it. No survey run at the start would have told us to do that. The willingness to pay we eventually captured didn’t exist yet when we would have measured it.
One that goes either way: you asked the wrong person
Whoever fills in your survey is rarely whoever signs the contract.
In B2B the person who responds is usually the person who uses the product, and they’re guessing about a budget they don’t control. Sometimes they guess low because they’re mentally spending their own money. Sometimes they guess high because they’ve heard what the company pays for other tools and the number sounds normal to them.
Which way it breaks depends on who picked up the survey. That’s not a bias you can correct for. It’s noise you can’t see.
Why B2B SaaS makes willingness-to-pay research worse
Everything above compounds when you move from a consumer buying chocolate to a company buying software.
The buying decision is distributed across a user, an economic buyer, and often procurement and security. The consumer studies measure one person deciding alone.
The commitment is recurring. You’re asking someone to price twelve months of a thing, including their guess about whether they’ll still want it in month eleven. Every study in the literature prices a one-time purchase.
The category is often new, especially in AI, so reference prices are missing exactly when the stakes are highest.
And the sample is small. Consumer studies run thousands of respondents. A B2B pricing survey with 60 responses from a specific ICP has confidence intervals wide enough to drive a truck through, before any of the bias above enters.
That combination is how I ended up looking at a price sensitivity meter that recommended roughly half of what customers were already paying. The respondents weren’t lying. They were guessing at a budget they didn’t own, for a product whose value they hadn’t experienced yet, and they had a mild incentive to guess low. Every one of those pressures pointed the same direction.
What to do instead of a pricing survey
Get the structure right first
Most teams reaching for willingness-to-pay research are asking the wrong question. They want to know what number to charge when they haven’t settled what they’re charging for.
Your value metric, your packaging, your fences between tiers. That’s most of the work, and getting it right matters more than the number attached to it. A well-structured pricing model at a mediocre price point beats a broken model at a perfect one, because the structure determines whether revenue grows with customer value or stays flat while your costs don’t.
Fix that first. Then the price point becomes a smaller question, which is convenient, because it’s the one you can’t research your way to anyway.
Then test on people who have to pay
Once the structure holds, run experiments where money changes hands. New-customer price tests, packaging changes on a segment, price increases rolled out to a cohort. The signal is weaker per observation than a survey and far more expensive to collect. It’s also real.
Ask about the past, not the future
Interviews still work, as long as you stop asking what people would pay.
Ask what they bought last year and what it cost. Ask what got cut in the last budget review and what survived. Ask who signed off, what the approval threshold is, what they compared you against. Those are questions about events that already happened, which people can answer accurately.
“What would you pay for this?” is a question about a hypothetical future, and you already know how those get answered.
Use the revealed preference data you already own
Most companies past a few million in ARR are sitting on better willingness-to-pay data than any survey would produce, and they’ve never looked at it.
Discount depth by segment tells you where your list price is wrong. Win-loss notes tell you where price killed a deal and where it never came up. Plan migration patterns tell you what customers upgrade for. Churn following a price change tells you what the market actually tolerated.
All of that is behavior, and it’s already in your systems.
Conclusion
Van Westendorp accuracy isn’t a matter of a fixable bias. The method produces a number that’s wrong by an unpredictable amount in an unpredictable direction, and it presents that number as a chart with an optimal point marked on it. The chart is the dangerous part. It converts a guess into something that looks like a finding.
Nobody in your survey lied. They answered a question about fairness while you asked a question about budget, they had no reference price, they hadn’t used the product, and some of them suspected what the answers were for.
Sort out your pricing structure. Then test price points on people who have to pay. That order matters more than any survey result.
Frequently asked questions
Is Van Westendorp accurate?
The method has barely been validated. The one published field test, Kloss and Kunter (2016), found the Van Westendorp optimal price landed close to an incentive-aligned benchmark, but the authors attribute that to two biases cancelling out rather than to the method working. Meanwhile meta-analyses put hypothetical willingness to pay at roughly 1.2 to 1.4 times actual on average, and nearly all of that evidence comes from consumer goods rather than B2B software. The deeper problem is that the error isn’t consistent in direction, so you can’t correct for it. Treat a Van Westendorp result as a rough sanity check on order of magnitude, not as a price.
When should you use Van Westendorp?
When you need a fast, cheap read on a price range for a product in an established category with a large consumer sample, and when the cost of being wrong is low. It’s also reasonable as one input among several. Treat the output as a hypothesis to test, not a price to launch.
How does conjoint analysis compare to Van Westendorp for pricing research?
Conjoint is better, because it measures choices between bundles rather than asking for a price outright, and choosing is something people do accurately. It’s the right tool for packaging and feature-tier decisions. It still overstates absolute willingness to pay unless it’s run in an incentive-compatible design where respondents can actually end up buying.
How does Van Westendorp compare to Gabor-Granger?
Gabor-Granger asks whether you’d buy at a series of specific prices and builds a demand curve from the answers. It gives you something Van Westendorp doesn’t, an estimate of revenue at each price point. Both are hypothetical, so both carry the same bias, and Gabor-Granger has the extra problem of anchoring respondents on whichever price you show first.
Does Van Westendorp measure price sensitivity?
It measures stated price perception, which is related but not the same thing. Real price sensitivity is how demand changes when you change the price, and you can only observe that by changing the price. The Van Westendorp curves show where respondents say a price starts to feel wrong.
Do pricing surveys work at all?
For relative questions, yes. Which features matter most, what belongs in which tier, how buyers rank benefits against each other. Those are comparisons, and people make comparisons reliably. Absolute price points are where surveys break down.
How do you measure willingness to pay in B2B SaaS?
Start with the data you already have: discount depth, win-loss reasons, plan migrations, churn after price changes. Add interviews about past purchases and approval thresholds rather than hypothetical prices. Then run live price tests on new customers or specific segments. It’s slower than a survey and it measures behavior instead of opinion.
Let's fix your pricing
Potio is a pricing consultancy for SaaS and AI companies.
Get a complete pricing redesign
and a clear rollout plan in one structured sprint.