How to find your SaaS value metric
Most pricing conversations I get pulled into open with the wrong question. Per seat or usage based? Would credits fix this? Should we charge per outcome like everyone else in AI?
Those are all second questions. The first one is what you charge for. The unit that makes the invoice go up when a customer gets more of it. That unit is your value metric, and once it is settled, most of the pricing model argument settles with it.
Get it right and pricing feels fair, accounts expand without a renegotiation, and your sales team stops fighting the same discount battle every quarter. Get it wrong and every tier structure you test will feel slightly off, because you are optimizing packaging around a unit that does not track anything your customer cares about.
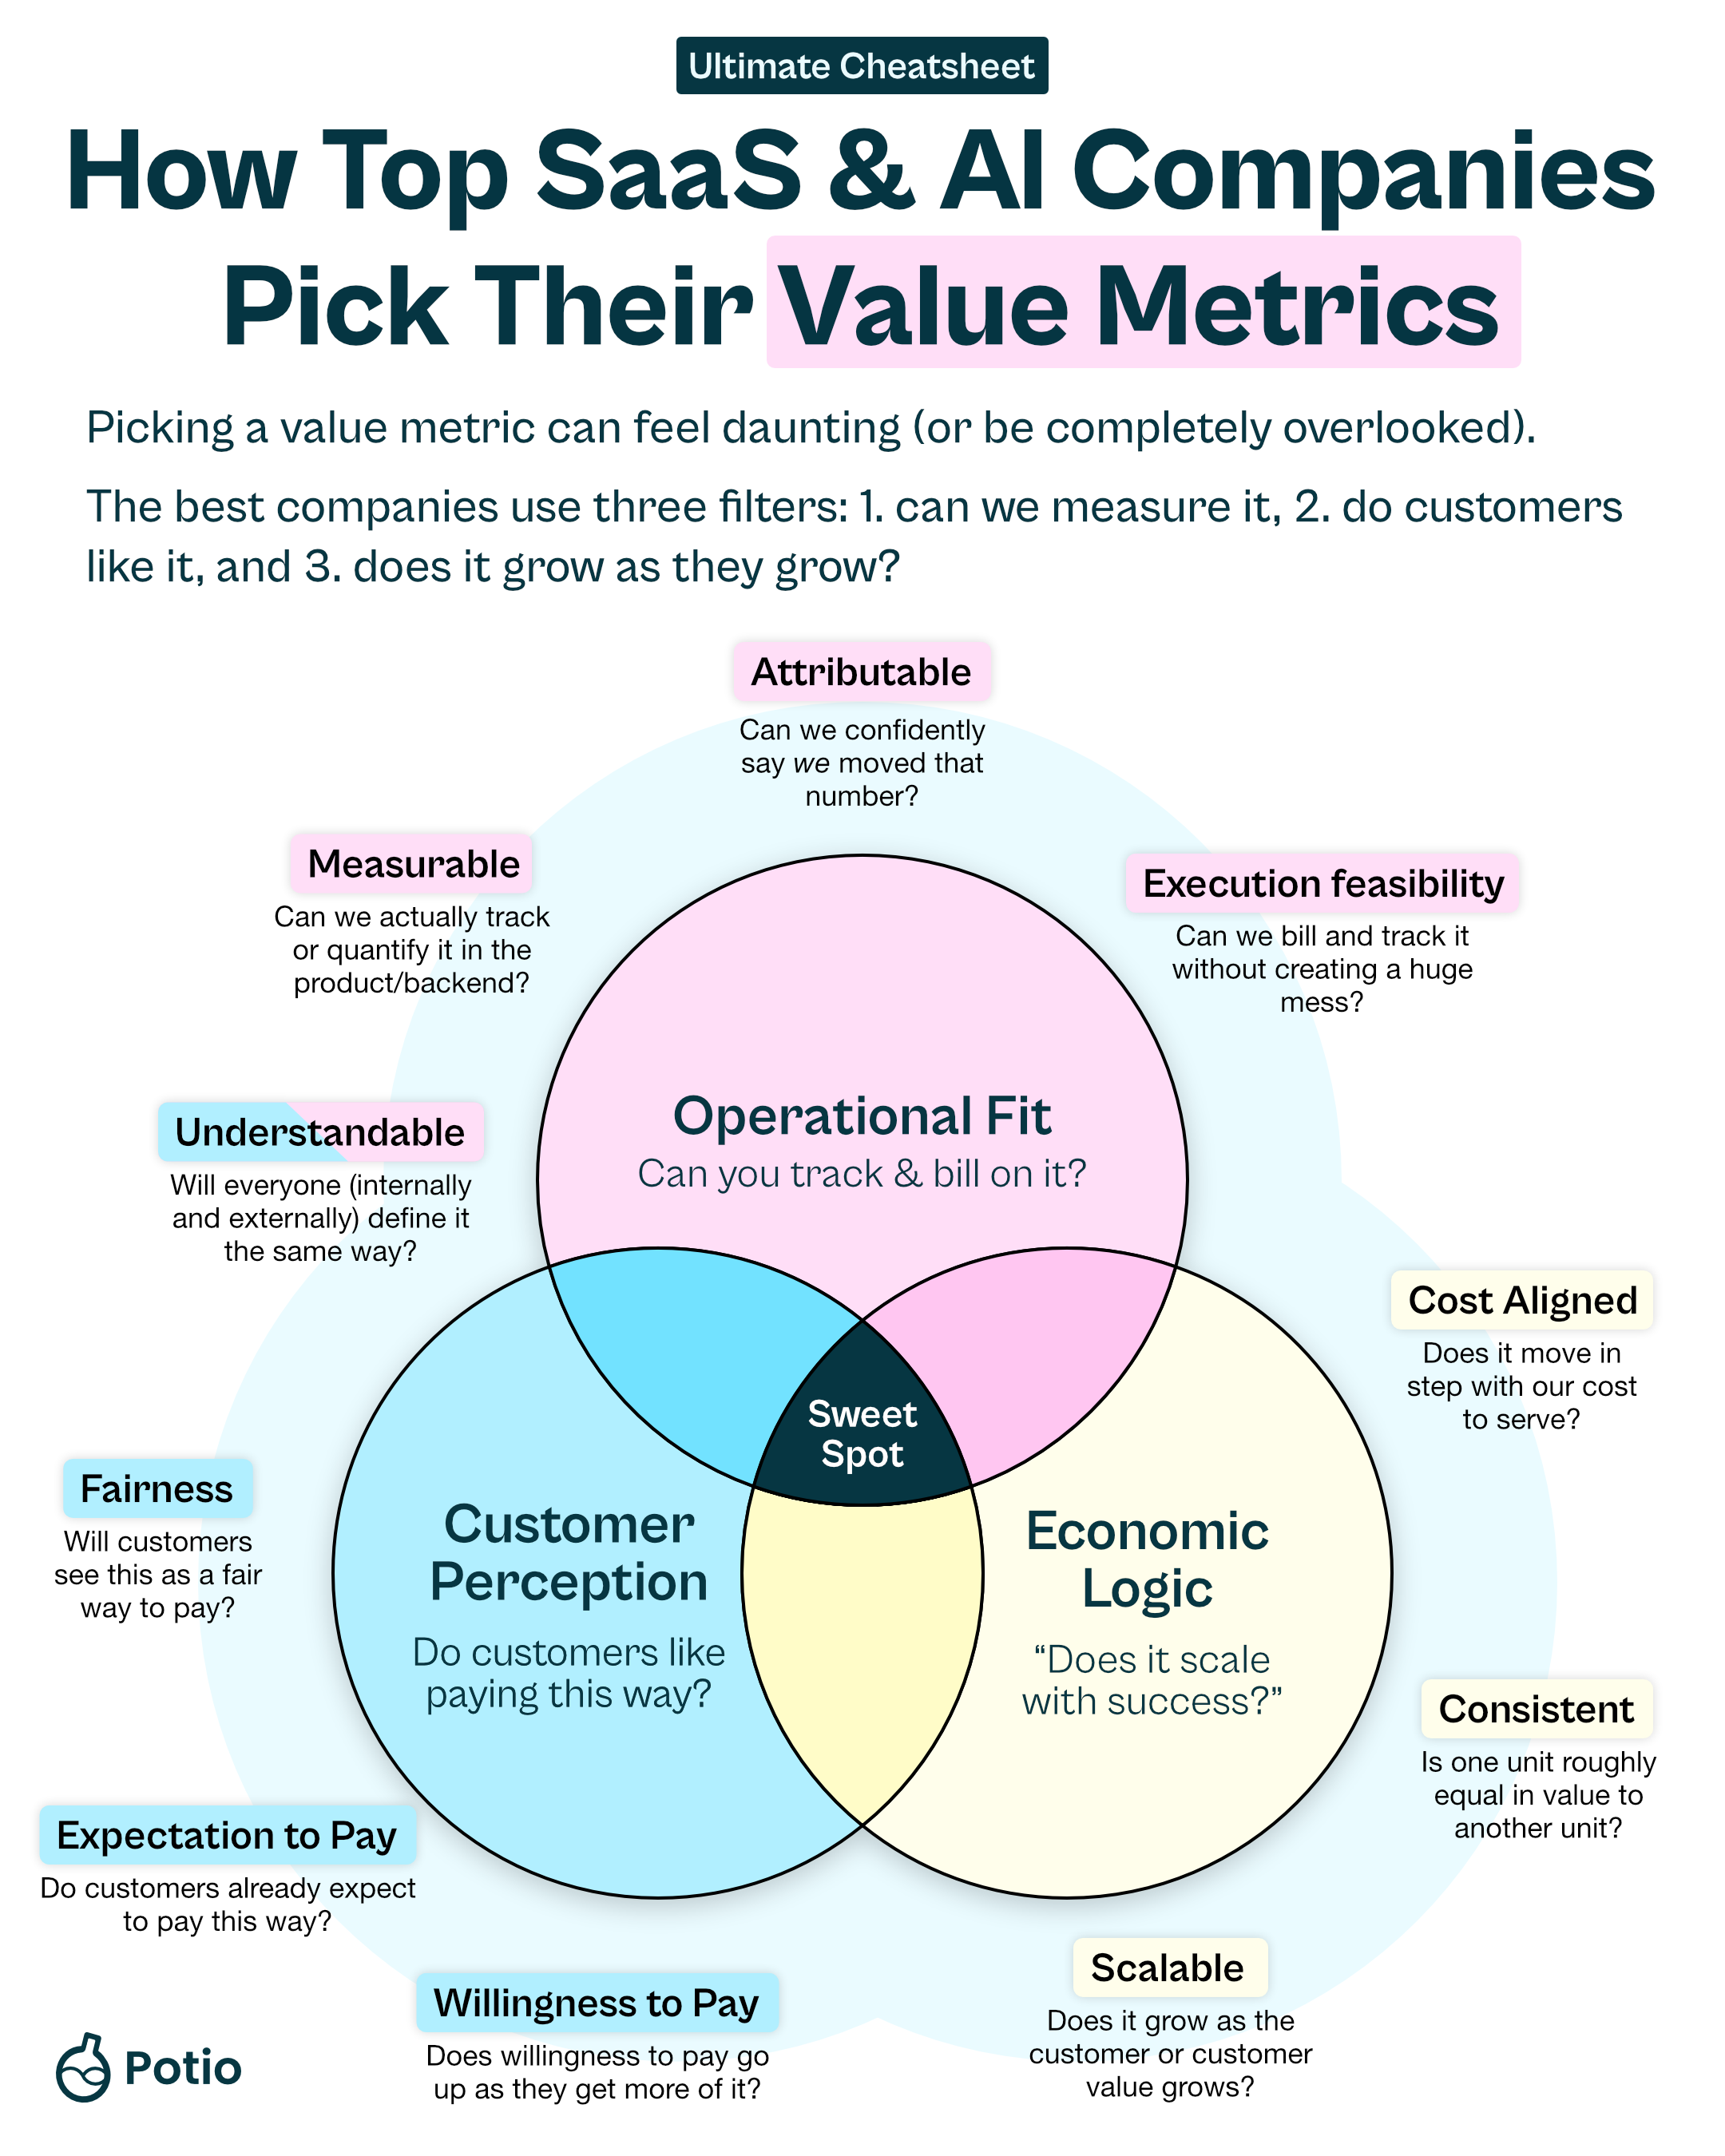
Finding the right one is a two step job. Build your customer’s value chain to generate candidates, then put each candidate through three filters. A metric has to clear all three.
What a value metric is, and why it decides your pricing model
A value metric is the unit you bill on. Stripe bills on the dollar processed. Slack bills on the active user. Snowflake bills on the compute credit consumed per second. Intercom’s Fin bills on the resolved conversation. Twilio bills on the SMS segment.
Your pricing model is the packaging wrapped around that unit. Tiers, bands, credits, commitments and overages are all decisions about how to sell the metric, and every one of them gets easier once you know what the metric is. Teams that argue about pricing models for six months are usually arguing about a value metric they never named.
Three symptoms tell you the metric underneath is wrong.
Every deal ends in a discount argument. Sales teams routinely concede 30% to 50% on first contracts when buyers cannot forecast their own usage or fear a penalty for growing. That is not price resistance. That is the buyer paying you to take the metric risk off their balance sheet.
Expansion needs a meeting. If accounts only grow when someone renegotiates, the metric is not attached to anything that grows on its own.
Customers work to consume less of it. This is the sharpest test. Before 2019, Mixpanel billed on total events ingested, so product teams stripped telemetry out of their apps to hold the invoice down. Mailchimp customers spent evenings archiving unsubscribed contacts to avoid a tier bump. When your buyers are actively suppressing the number you bill on, you are charging for a cost, not for value.
Build the value chain before you shortlist metrics
Most teams start this exercise by listing things they could bill on. Seats, API calls, storage, workflows, whatever the product already counts. That is a list of things your database happens to know, and it has nothing to do with what your customer is trying to get done.
Start at their end instead. Two questions build the chain.
What is the customer trying to achieve? That gives you the last step.
What has to happen before that outcome is possible? And before that? Keep going backwards until you reach the moment they sign up. That gives you every step in between, in order.
Calendly is the example I use most often with clients, because the chain is four steps and everyone has lived it:
- Set up an account, define meeting types, connect calendars
- Share booking links or embed them on your site
- Meetings get booked and confirmed
- Time is saved and the meetings actually happen

Now put candidate metrics under each step. All of them, including the ones you would never ship, because the weak ones are what make the strong ones obvious. For Calendly that gives you users, calendars connected and meeting types at step one, link views at step two, meetings booked and participants per meeting at step three, and at step four either meetings that actually happened or some ROI measure of time saved.
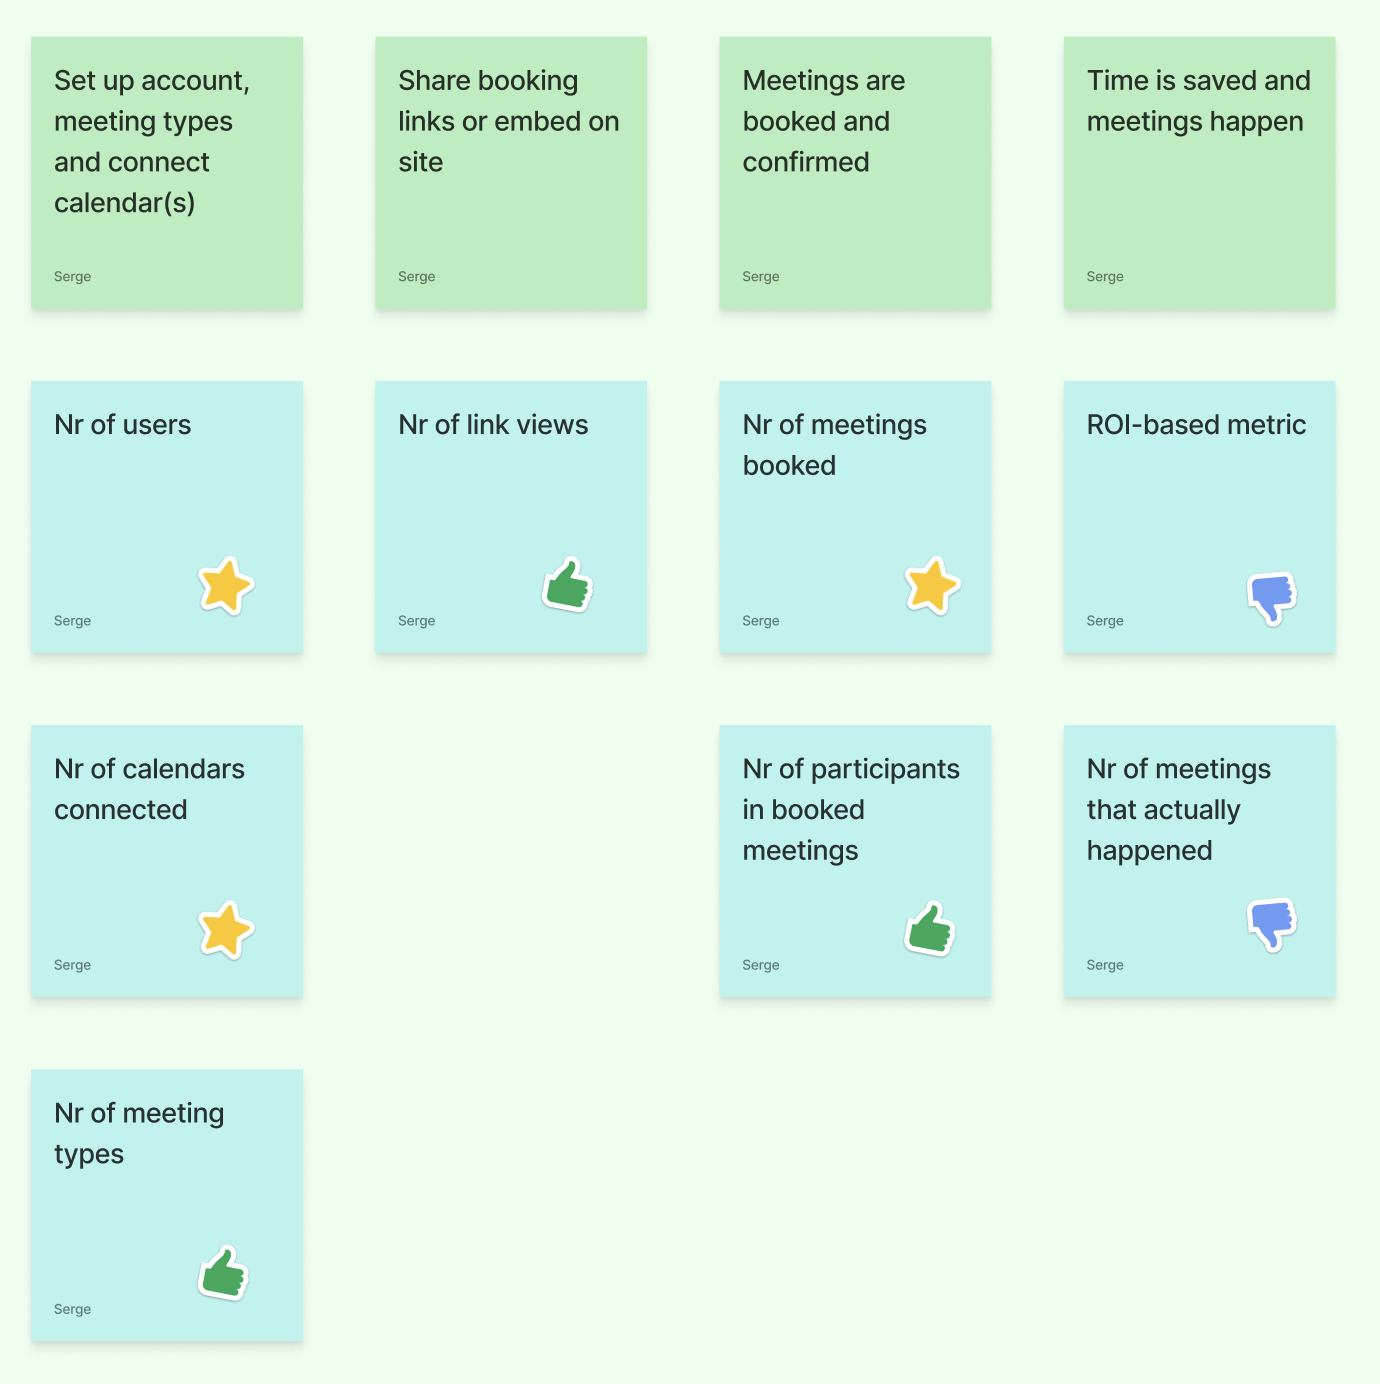
Then score every candidate on two questions, in this order.
How easy is it to measure and attribute? Easy, possible, or hard. Hard is not a maybe. Discard it on the spot, and do not let anyone rescue it on the grounds that it is the real value, because a number you cannot compute is not a metric.
How well does it correlate with perceived value? Three answers. The customer is happy to pay more as it grows. The customer understands why you charge on it but does not love it. Or neither.
Watch what that does to Calendly. The two candidates at step four, the ones sitting closest to the actual value, both die immediately on the first question. Calendly cannot see whether a meeting happened, cannot know what an hour of your time is worth, and cannot claim credit for either. Users, calendars connected and meetings booked come out strongest. Link views and meeting types survive as workable but weaker.
A dozen candidates down to three, in about twenty minutes, before anyone has opened a spreadsheet. In my experience this screen removes roughly 80% of what goes on the board. What survives is worth taking through the three filters.
Note where Calendly actually landed: per user, at step one, the furthest point from the value. That is not laziness, and the next three sections explain why it is right for them and wrong for plenty of other companies.
Operational fit: can you track and bill on this metric?
A metric you cannot measure without an argument is not a metric. This filter kills more candidates than the other two combined, and it kills them for boring reasons rather than strategic ones. Three questions sit inside it.
Measurable: can your product actually produce the number?
Not “roughly”. Non-arbitrarily, on a schedule, in a form the customer will agree with.
Take the most common metric in software, the monthly active user. Obvious until you have to write the definition down. Does a trial account that never converted count? A service account your integration created? Someone whose only activity that month was your own system syncing their directory over SSO, or their phone receiving a push notification they never opened? Someone the customer offboarded on the 3rd, who still shows nine days of session history?
None of those questions is hard on its own. One of them will be, and you find out at implementation, after the number is already on the pricing page and in the contract.
Slack is the company that took this seriously enough to build for it. Their Fair Billing Policy tracks daily activity and automatically credits back seats that went unused, which only works because they committed to a defensible definition of active before they sold on it. Most vendors do the opposite: they ship the metric, then discover their telemetry counts machine events as human activity, and spend the next two years reconciling invoices by hand.
Attributable: can you say you moved that number?
Outcome metrics fail here more often than anywhere else. A resolved support ticket works because resolution has a programmatic boundary, which is exactly why Sierra, Decagon and Intercom’s Fin can all sell per resolution. A closed bug, a won deal or a shipped feature does not. Too many hands touch it, and the moment your invoice depends on a judgment call, you have hired yourself into a monthly dispute.
Feasible: can you bill it without building a billing company?
Metered billing breaks in five specific places, and the vendors who build this infrastructure for a living all name the same ones: dropped events when ingestion queues fail to acknowledge, late-arriving events that land after the invoice closes, duplicate events from retried payloads with no idempotency key, concurrent credit burn-down driving a balance negative before rate limits engage, and sub-cent rounding errors compounding across millions of transactions.
The cost of getting this wrong is measurable. MGI Research found 42% of companies experience revenue leakage, typically 3% to 5% of annual revenue, and 59% report meaningful customer friction from billing disputes. Ernst & Young put the EBITDA hit at 1% to 5% a year.
Practical rule: instrument the metric and watch it against real accounts for a full quarter before you bill a cent on it. If you cannot reconcile it to your own satisfaction with no money at stake, your customers will not reconcile it with money at stake.
Customer perception: do customers like paying this way?
Value alone does not create willingness to pay. Expectation to pay does at least half the work, and it is the half most teams skip.
Think about how you pay your accountant. An hourly rate, no argument. A filing fee passed through at cost, fine. Now imagine a line item for “answered your emails promptly and explained things clearly.” You would refuse to pay it, and you would be annoyed at being asked, even though that is genuinely the reason you use that accountant instead of a cheaper one.
The value is real. The expectation to pay is zero. That gap is where pricing models die, and it has nothing to do with whether your product is good.
Understandable: will everyone define it the same way?
Internally and externally, in the same words. If your AE explains the metric one way and your billing system computes it another, you have not built a pricing model, you have built a dispute pipeline.
Fair: will customers see it as a reasonable basis for payment?
Expectation to pay comes from three places. Habit, meaning this is how you already pay for things like this. Cost transparency, meaning you can see why the vendor incurs a cost here, which is why API calls and cloud egress are accepted so easily. And similarity, meaning the model resembles something you already know. Netflix priced streaming per month because a magazine subscription had already trained everyone.
Mailchimp’s 2019 switch failed on fairness rather than on price. The company moved from billing on active subscribed addresses to billing on total audience contacts, which counted unsubscribed and pending records toward your tier. Customers were being asked to pay storage fees for people who had explicitly opted out of hearing from them. Mailchimp captured higher revenue per remaining account and lost a cohort to Klaviyo and Brevo.
Wanted: does willingness to pay rise as they get more of it?
This is the one teams get backwards. A metric can track value perfectly and still be something the customer is trying to buy as little of as possible.
Where a metric sits on the customer’s value chain decides the answer. Attach your price early, at the investment end, and you are a cost the customer will work to control. Attach it late, near the outcome, and you are a partner sharing what they made.
This is why Calendly can charge per seat and get away with it when plenty of other companies cannot. The person who sets up a Calendly account is the same person whose time gets saved, so value lands on the seat holder. More seats genuinely means more value, and customers add them without being pushed.
Seats break when the seat holder is not the beneficiary, when your customer is staffing a team in order to produce value somewhere else entirely. Then buying the minimum is the correct decision, and your expansion waits on their project. If that project takes eighteen months to pay off, so does your expansion cycle, and no amount of CSM attention changes it.
Procore made the opposite bet. Construction software with unlimited collaborator seats, priced instead on the annual construction volume the customer manages. Every contractor, subcontractor and architect gets pulled onto the platform for free, which is exactly what makes the platform work, and revenue tracks the customer’s project volume rather than their headcount. ServiceTitan runs the same play from another angle: field technicians are metered, back-office staff are not.
The rule: anchor as far toward the outcome end as your other two filters allow, and be honest with yourself about which end your current metric actually sits on.
Unity is the extreme version. In September 2023 the company introduced a runtime fee of $0.01 to $0.20 per install once a game passed $200,000 in trailing revenue, applied retroactively to shipped titles with no grandfathering, calculated from Unity’s own telemetry estimates. Developers boycotted Unity Ads, ported to Godot and organized legal action. The CEO resigned. On 12 September 2024 the new CEO cancelled the fee entirely and replaced it with an 8% to 25% price increase on Pro and Enterprise seats.
Read that last sentence again. A double-digit price increase went through where the new metric could not. Price levels are negotiable. Metrics are structural, and buyers treat them that way.
Economic logic: does the metric scale with customer success?
The first two filters keep you out of trouble. This one is where the money is.
Scalable: does it grow as the customer grows?
The metric should grow without a renegotiation, without a QBR and without anyone at your company doing anything. OpenView’s State of Usage-Based Pricing benchmarks put median net revenue retention at 125% for usage-based companies against 115% for subscription peers, with annual growth of 33.7% against 23.2%.
Check the sample before you act on those numbers. OpenView and ICONIQ datasets lean heavily on venture-backed infrastructure and developer platforms, where consumption rises with internet traffic more or less on its own. Broader samples covering bootstrapped mid-market B2B, like ChartMogul’s, find pure usage models carry higher contraction volatility in a downturn, because the same automatic expansion runs in reverse when customers start filtering logs and trimming retention windows. Snowflake lived both halves of that between 2020 and 2024.
Consistent: is one unit worth roughly what the next one is worth?
Consistency, also called pricing density. If you sell a usage model, this is the filter that decides whether it closes cleanly or gets negotiated down on every single deal.
A dollar processed through Stripe is worth the same to the merchant as the next dollar. That uniformity is why a percentage take rate sells with almost no friction. There is no conversation to be had about whether one particular dollar deserved the fee.
Now the opposite. Any metric whose average hides a long tail will fight you:
- $5 per tracked patient record in clinical software. An ICU or oncology case justifies it hundreds of times over. A routine outpatient checkup does not, and nobody can tell which is which before processing it. Administrators respond by refusing to digitize low-acuity records, so the platform gets a fractured dataset and the hospital keeps a parallel paper system.
- $2 per work order in field service. A $50,000 chiller replacement absorbs it invisibly. A five-minute warranty callback does not, so dispatchers bundle unrelated jobs onto master tickets to dodge the fee.
- $0.10 per page in legal document processing. One page carrying a dispositive indemnification clause is worth thousands. Four hundred pages of boilerplate appendix are worth nothing, so firms write scripts to strip appendices before ingestion.
Notice what the buyer does in each case. They do not churn. They distort their own workflow to game the input, which makes your product less useful and your data worse, and then they ask for a discount anyway because they know most of what they send you is low-value volume. That is the tell. If you are seeing workarounds, the fix is not a lower unit price. It is structural, and each option costs you something.
| Fix | How it works | What it costs you |
|---|---|---|
| Banding | Group volume into stepped brackets | Customers suppress usage right below each threshold |
| Prepaid credits | Different actions draw different credit amounts | Procurement reads credits as hidden price inflation |
| Minimum commitment | A floor that guarantees margin on small accounts | Kills trial adoption, lengthens the first deal |
| Platform fee plus usage | Fixed base captures access, usage captures growth | Buyers resent paying for access and consumption both |
| Spend caps | Contractual ceiling relative to their volume | You absorb the spike risk instead of them |
None of those is wrong. They are the reason consumption based pricing is harder to run than it looks, and picking one is a real decision rather than a detail.
Cost aligned: does it move with your cost to serve?
This filter used to be a rounding error for software companies and is now the thing keeping AI founders awake. GitHub Copilot’s flat $10 seat is beautifully predictable and completely exposed when one developer runs compute-heavy workloads all day. OpenAI’s per-token pricing protects margin perfectly and means nothing to a buyer who cannot translate a million tokens into a business result.
Neither is a mistake. Both are trades, and every company selling AI right now is making one.
Value metrics by industry: what twenty companies actually charge on
Copying a metric from a company you admire is the most common way teams get this wrong, because the metric is a function of their value chain and their buyer, not of their category. Use this to see the range of what is possible, not as a shopping list.
| Company | Category | Value metric | Entry price |
|---|---|---|---|
| HubSpot | CRM | Marketing contacts | $15/seat/mo (Starter) |
| Salesforce | CRM | Named user seats, plus consumption credits | $25/user/mo (Starter Suite) |
| Slack | Communication | Active seats, refunded when inactive | $7.25/user/mo (Pro) |
| Twilio | Communication | SMS segment or voice minute | $0.0079/SMS segment |
| Loom | Communication | Creator seats, viewers unmetered | $12.50/creator/mo |
| Stripe | Payments | Payment volume processed | 2.9% + $0.30 per transaction |
| Plaid | Fintech | Connected accounts, plus per-call fees | Pay as you go |
| AWS | Infrastructure | Compute time and storage volume | From ~$0.0104/hr (EC2) |
| Vercel | Infrastructure | Data transfer and edge invocations | $20/member/mo (Pro) |
| Snowflake | Data | Virtual warehouse credits per second | $2.00 to $4.00 per credit |
| Datadog | Data | Monitored hosts, plus 20+ overage dimensions | $15/host/mo (Pro) |
| Fivetran | Data | Monthly active rows | Free to 500k MAR |
| Mixpanel | Data | Monthly tracked users | $20/mo to 10k MTU |
| Klaviyo | Marketing | Active profiles stored | $20/mo (500 profiles) |
| Intercom (Fin) | Support | Resolved conversations, plus seats | $29/seat/mo + $0.99/resolution |
| Sierra | Support (AI) | Resolved customer sessions only | ~$1.00 to $2.50 per resolution |
| Gusto | HR | Base fee plus per employee per month | $40/mo + $6/person/mo |
| Snyk | Security | Contributing code committers | $25/developer/mo (Team) |
| Procore | Vertical | Annual construction volume managed | Custom, from ~$10k |
| ServiceTitan | Vertical | Active field technicians, office seats free | ~$200 to $300/tech/mo |
Prices are as listed in early 2026 and move constantly, so treat them as shape rather than as current numbers.
Two things in that table are easy to miss. Loom bills creators and not viewers. ServiceTitan bills technicians in trucks and not the back office. Both companies deliberately left a large population unmetered because free adoption there produces more of the thing they do bill on. Deciding what to give away is part of choosing the metric, not a separate generosity exercise.
From value metric to pricing model
Once the metric is settled, the pricing model is mostly a consequence. Each metric shape has a model that fits it and a failure mode that comes with it.
| Metric shape | Model that follows | Examples | Failure mode |
|---|---|---|---|
| Per person who uses it | Per-seat tiers | Figma, Notion, Harvey | Shelfware, and buyers minimizing headcount on the platform |
| Volume consumed, uniform value | Metered usage | Twilio, AWS, PostHog | Bill shock without caps and alerts |
| Volume consumed, lumpy value | Prepaid credits | Clay, Replit, Zapier | Opacity, and procurement treating credits as markup |
| Value flowing through the product | Take rate | Stripe, Shopify, Recharge | Only works when you sit next to the money |
| A completed job | Per outcome | Intercom Fin, Sierra, Decagon | Needs a programmatic definition of “done” |
| Things under management | Per unit | Datadog hosts, CrowdStrike endpoints, Gusto employees | Tracks their org size, not their success |
If you want to go a level deeper on the packaging decisions that sit on top of each of these, I covered the full set of SaaS pricing models separately.
Why most companies end up with two metrics
The single-metric rule is a useful teaching device and a bad description of what shipping companies actually do. There is a trilemma underneath, and you get two of three.
- Value alignment. You charge for the customer’s success rather than for access.
- Financial predictability. Procurement can budget the line item twelve months out.
- Margin protection. Your inference and infrastructure costs are always covered.
Sierra picks value alignment and margin protection. Pure outcome pricing at roughly $1.00 to $2.50 per resolved session, no seat fees at all, which is only sellable because it comes wrapped in a $150,000-plus annual platform floor and a $50,000 to $200,000 integration fee. Those floors are the predictability the buyer lost, bought back in a different currency.
GitHub Copilot picks predictability and alignment, and eats the margin variance on heavy users because owning the developer relationship is worth more than the compute.
Salesforce tried to pick alignment with Agentforce and listed it at $2.00 per conversation in late 2024. Procurement objected on budget unpredictability and on edge cases about what counts as a billable session. Salesforce moved to pooled Flex Credits within months.
That is why AI pricing has converged on hybrids rather than on pure outcome models. A platform or seat fee that protects the floor, plus a usage or outcome layer that captures growth:
- Intercom Fin: seats at $29, $85 or $132 per month, plus $0.99 per resolution, with a 50-outcome monthly minimum
- Zendesk: agent seats, plus $1.50 to $2.00 per autonomous AI resolution
- Cursor: $20 per seat with a pool of fast requests, then overage
- Clay: platform actions billed separately from data credits passed through at cost, after a March 2026 overhaul that cut data pricing by 50% to 90%
There is also a category where seats remain the right answer and always will. Internal tooling that sits several steps from the customer’s revenue, like Jira, Linear or Retool, has no honest outcome to bill on. Charging per bug closed or per feature deployed distorts engineering behavior and invites gaming within a week. Seats work there precisely because they track adoption without interfering with the work.
Changing a value metric without a revolt
Four migrations, two that worked and two that did not, and the pattern separating them is not subtle.
Mixpanel, 2019. Moved from total events ingested to monthly tracked users. Customers had been deleting telemetry to control invoices, which made the product worse and the data thinner. After the switch, tracked data volumes rose by more than 300% per account and logo churn fell. They moved toward a metric customers wanted more of.
Clay, March 2026. Split one credit pool into data credits passed through near wholesale and actions covering the platform’s own work. Accounts were migrated with expanded allowances. Gross margin on data resale dropped, retention rose.
Mailchimp, 2019. Enforced on existing accounts, with the burden on customers to manually archive records or absorb a tier bump. Higher revenue per surviving account, permanent goodwill damage, a visible exodus to competitors.
Unity, 2023. Retroactive, opaque, calculated from telemetry the customer could not audit, applied to games already shipped. Reversed in under twelve months at the cost of the CEO’s job.
Four rules fall out of those:
- Migrate toward a metric customers want more of. If the new unit is something they are trying to minimize, you have bought yourself a churn cohort.
- Never apply it retroactively. Existing contracts finish under existing terms. There is no exception to this one.
- Expand allowances on migration. The first invoice under the new metric should not be higher than the last invoice under the old one. Take the revenue on the second cycle.
- Publish the definition before you bill on it. Every edge case, in writing, with worked examples. If you cannot write it down clearly, it fails the operational fit test and you are not ready.
Changing the metric is a structurally harder move than changing the price, and the two get confused constantly. Unity proved the point by accident when the 25% price increase sailed through after the metric change collapsed.
Stress-test your own metric in ten questions
The two-question screen earlier narrows a dozen candidates to three. These ten decide between them. This is the full checklist behind the three filters, and running a client through it is where most of my SaaS and AI pricing engagements at Potio begin, well before anyone opens a pricing page.
Operational fit
- Can you quantify it in the product or backend, without judgment calls?
- Can you confidently say your product moved that number?
- Can you bill and reconcile it without building a metering team?
Customer perception
- Will everyone, internally and externally, define it the same way?
- Will customers see it as a fair basis for payment?
- Do customers already expect to pay for things like this?
- Does their willingness to pay rise as they get more of it?
Economic logic
- Does it grow as the customer or their value grows?
- Is one unit worth roughly what the next unit is worth?
- Does it move in step with your cost to serve?
How to read your answers. A no on any of the first three kills the metric outright, because you cannot invoice something you cannot measure. A no in customer perception is usually survivable with packaging, which is what credits, bands and commitments are for. A no on economic logic means the metric works but you will be renegotiating for growth forever, which is a slow, expensive way to run a company.
Very few metrics score ten out of ten. The sweet spot in the middle of that diagram is a direction, not a destination. What matters is knowing which filter you failed and what you are doing about it, rather than discovering it in a discount conversation eighteen months from now.
Frequently asked questions
What is the difference between a value metric and a pricing model?
The value metric is the unit you bill on, like a seat, a resolved conversation, a gigabyte or a dollar processed. The pricing model is how you package and sell that unit, including tiers, bands, credits, commitments and overages. The metric comes first. The model is a set of decisions about how to sell it.
Can a SaaS company have more than one value metric?
Most of the companies in the table above run two. A primary metric that scales with customer value, and a secondary fence that segments buyers or protects margin. Intercom charges seats and per resolution. Vercel charges seats and data transfer. Gusto charges a base fee and per employee. Trying to force everything into one metric usually means giving up either predictability or margin, and you generally cannot afford to give up either.
Is per-seat pricing dead for AI products?
No, but it stopped being the default. Seats survive where the software supports a human doing work, which is why Harvey still sells named legal seats at roughly $1,200 a year and GitHub Copilot still sells developer seats. Seats break where the software replaces the work rather than assisting it, because the customer’s headcount falls exactly when your value rises. Most AI companies now run seats plus a consumption or outcome layer rather than choosing between them.
How do I know my current value metric is wrong?
Three signals. Discounts above 30% appearing routinely on first contracts rather than on strategic accounts. Expansion revenue that only arrives through renegotiation. And customers building workarounds to reduce the number you bill on, like stripping events, bundling tickets or archiving records. The third is the most reliable, because it means the metric measures a cost to them rather than a benefit.
Does usage-based pricing actually grow faster than seat-based pricing?
In venture-backed infrastructure and developer platforms, yes. OpenView’s benchmarks put usage-based companies at 125% median net revenue retention against 115% for subscription peers. In broader samples of bootstrapped and mid-market B2B software, the gap narrows and pure usage models show more contraction in downturns, because automatic expansion also runs automatically in reverse. The right question is not which model grows faster on average, it is whether your metric grows on its own inside your customers’ business.
How often should you change your value metric?
Rarely, and only for a structural reason. Product scope changing, cost structure changing, or clear evidence customers are suppressing the current metric. A metric migration touches contracts, billing, sales compensation and every forecast in the company, so it is not a quarterly optimization. Price levels can move annually. Metrics should hold for years.
Let's fix your pricing
Potio is a pricing consultancy for SaaS and AI companies.
Get a complete pricing redesign
and a clear rollout plan in one structured sprint.