AI unit economics: how to escape the token furnace
In SaaS, cutting your price by 50% meant you were probably dying. In AI, it might mean you’re winning.
That sentence would have gotten me laughed out of a board meeting a few years ago. Traditional SaaS ran on 80 to 90 percent gross margins with a fixed cost base. A price cut went straight to the bottom line and there was nowhere to hide.
AI companies live somewhere else. Competitors undercut you and the underlying compute gets cheaper every quarter, so prices drop, sometimes dramatically. But if your costs are falling faster than your prices, the pie grows.
The question is how you’d know. ARR won’t tell you. Neither will your gross margin percentage, which can sit flat while the business underneath it changes shape completely. AI unit economics need two numbers your SaaS dashboard probably doesn’t have.
Why AI unit economics break the SaaS playbook
The old playbook assumed your cost of delivery was small and flat. It isn’t anymore.
Median gross margin for software companies sits around 80 percent, according to Aleph’s 2026 SaaSBench read of 342 companies. Usage-only pricing models in that same data average about 62 percent. AI-native companies run lower still. Bessemer’s 2025 State of AI report put LLM-first companies at roughly 65 percent median, and ICONIQ’s 2026 data came in at a 52 percent weighted average. The reason is structural. Once the cost of delivery moves with every request, cost-based pricing quietly comes back whether you planned for it or not.
Two curves then move at once, in opposite directions.
Token prices are collapsing. BenchLM’s token price index has frontier models down more than 80 percent since March 2023. Stanford’s AI Index tracked GPT-3.5-equivalent inference falling from $20 per million tokens in late 2022 to $0.07 by October 2024, a 280x drop. Anthropic’s inference margin reportedly went from around 38 percent to over 70 percent during a stretch when it was cutting prices.
Token consumption per task is exploding. Stanford’s Digital Economy Lab found agentic coding tasks consume roughly 1,000 times more tokens than a simple question. Accenture watched one client’s AI tool usage jump 113x in ten weeks, with 19 percent of users driving 80 percent of spend. Uber burned through its annual AI coding budget in four months.
Cheaper tokens do not mean cheaper AI. Your cost per customer outcome can climb while your cost per token falls, and nothing on a standard SaaS dashboard shows you which way it’s going.
Two numbers that replace ARR
Kyle Poyar recently laid out the two metrics that cut through this, and I’d argue they’re the only two worth watching right now.
Consumption of your unit of delivery. Tokens, audio hours, API calls, images generated, whatever you actually ship. This is the “are people using this” number and it’s hard to fake. Seats sit unused. Contracts get signed and forgotten. Consumption is behaviour.
Gross profit per unit of consumption. Not margin percentage. Gross profit in currency, per unit. This is what separates the companies riding the cost curve from the ones drowning in it.
Percentage margin hides direction. A company at 55 percent margin whose per-token gross profit doubled in a year is in a completely different position to one at 55 percent whose per-token gross profit halved. The percentage looks identical in both cases.
Tomasz Tunguz found that AI company valuations track gross profit per token more closely than they track total token volume. Investors worked this out before most operators did.
Both numbers depend on knowing what you actually bill on, which is the same problem as finding your value metric. If you can’t name your unit of delivery in one word, start there.
AI Profit Matrix: four quadrants of AI unit economics
Plot those two numbers against each other and you get four positions. I call it the AI Profit Matrix.
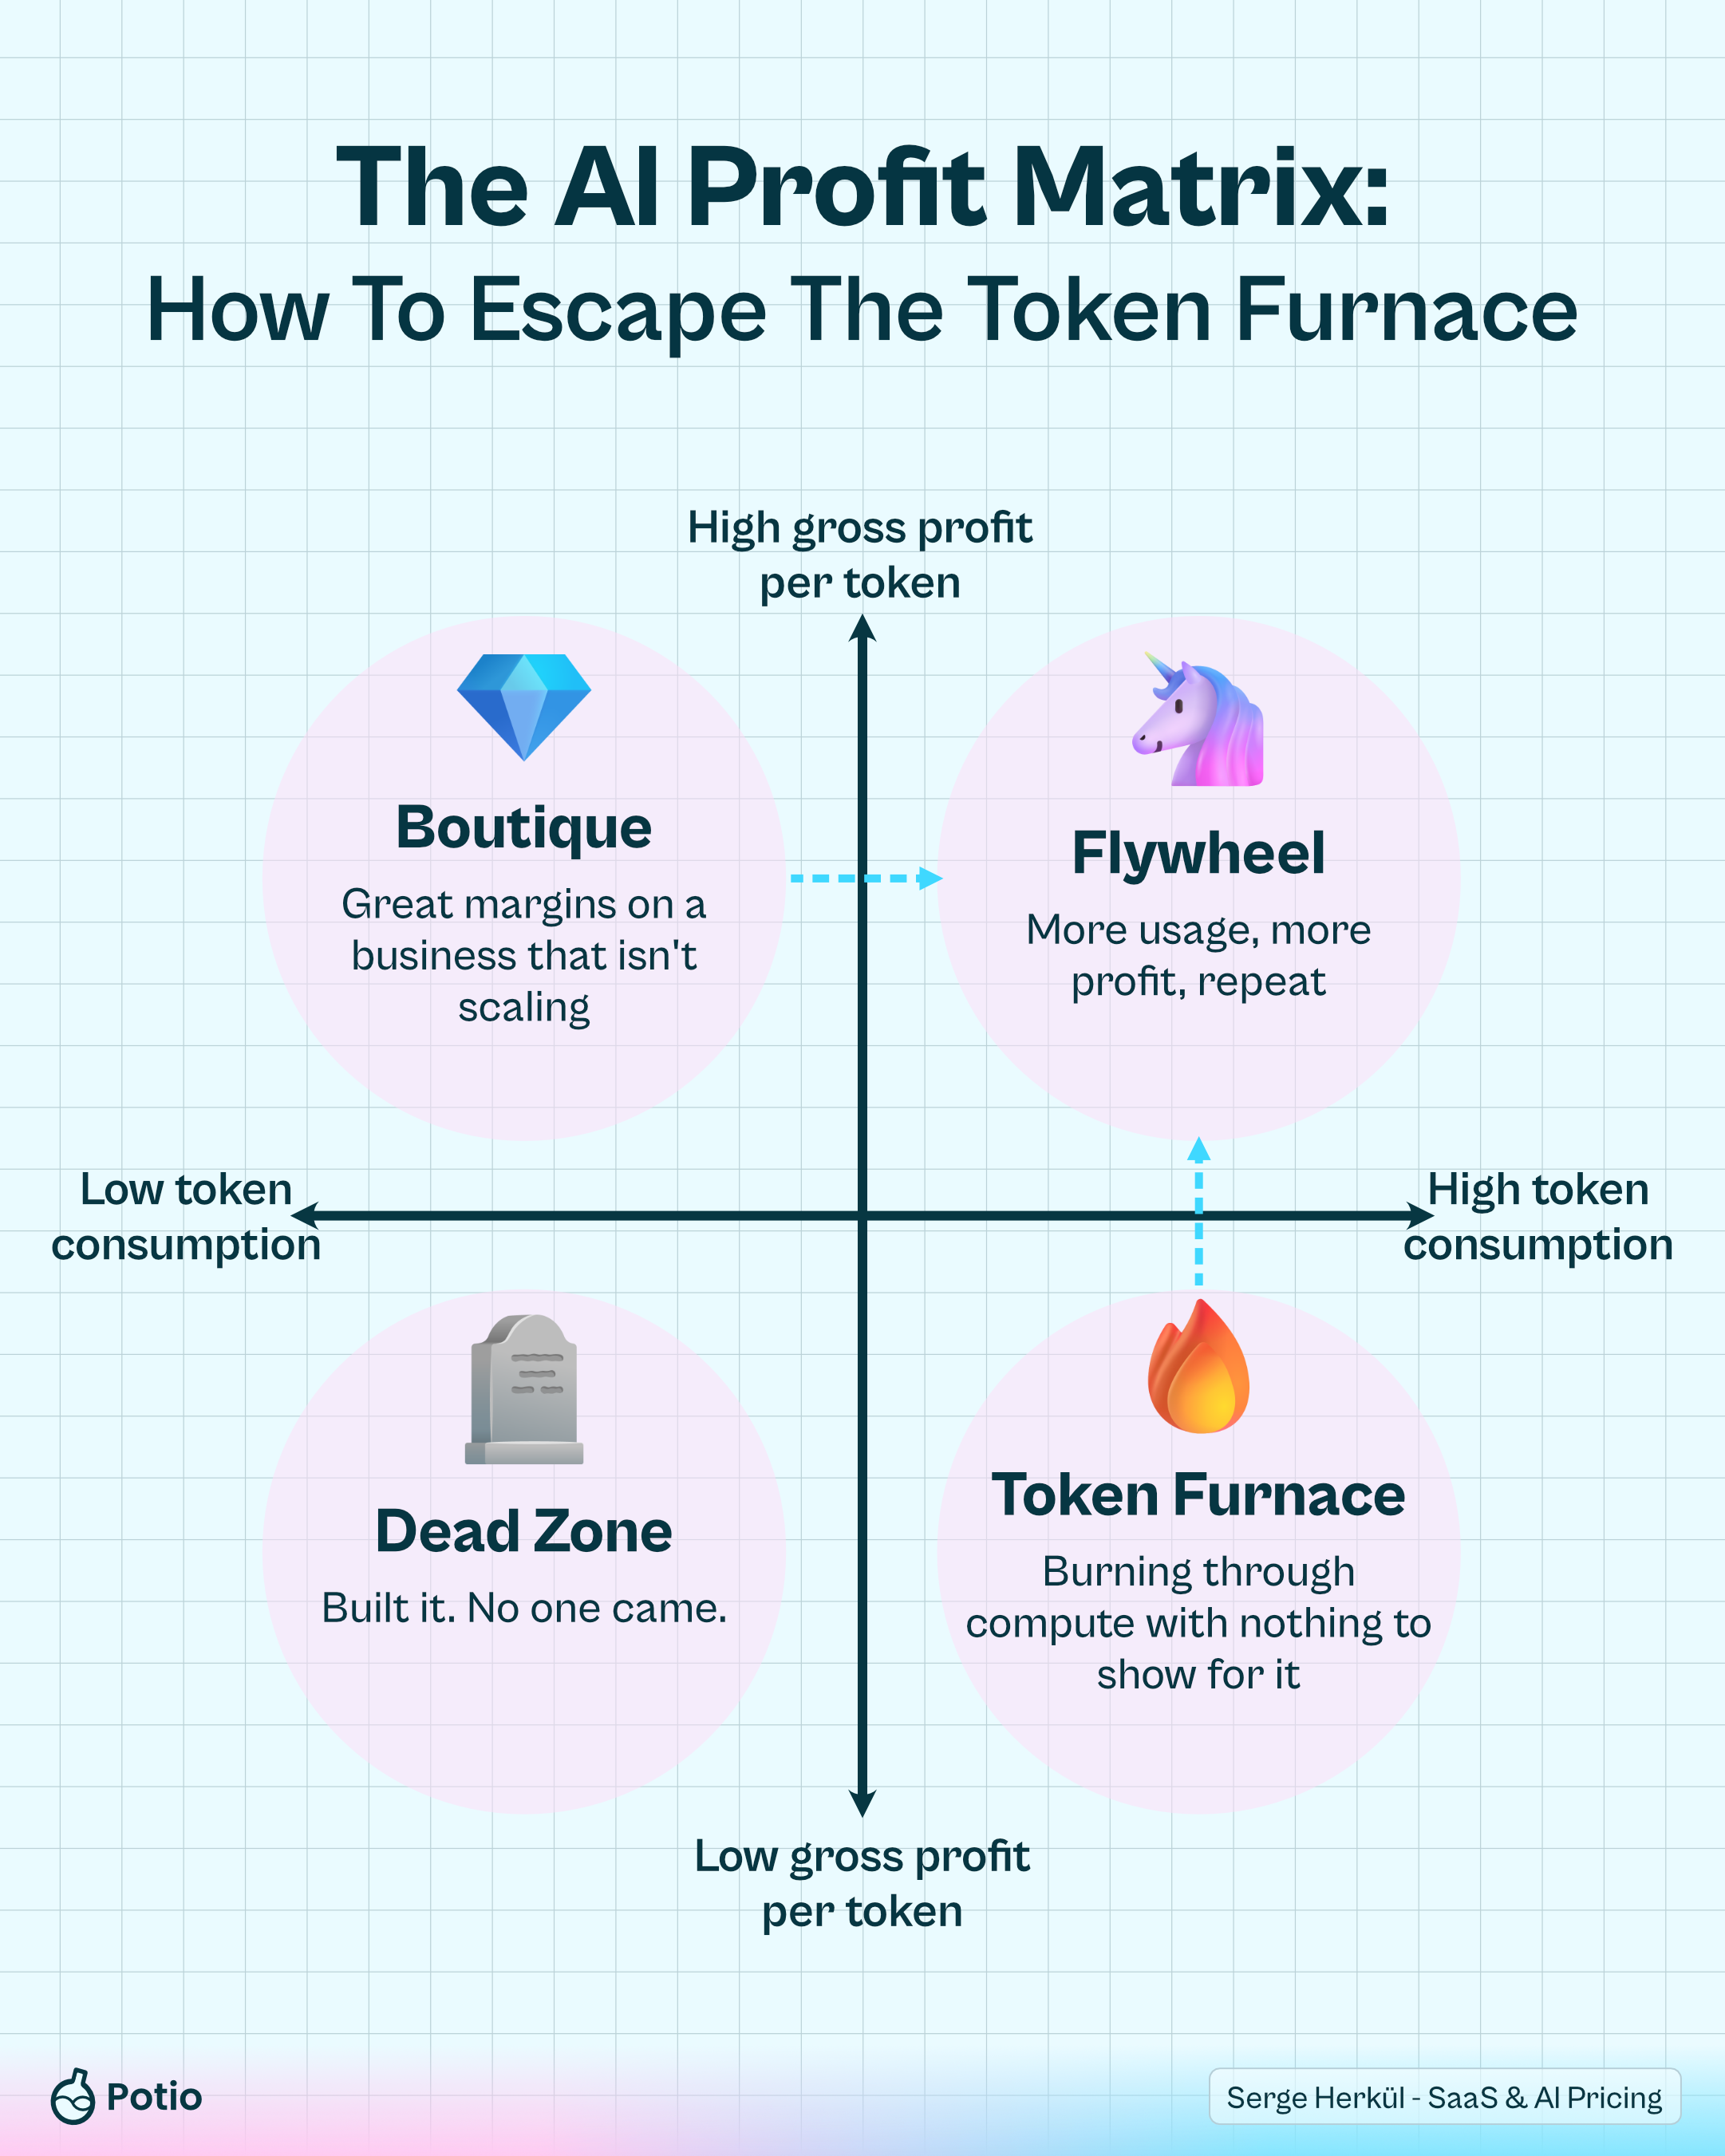
| Quadrant | Consumption | Gross profit per unit | What to do about it |
|---|---|---|---|
| Dead zone | Low | Low | Reposition the feature or turn it off |
| Token furnace | High | Low or negative | Fix the unit economics before you scale further |
| Boutique | Low | High | Spend margin on buying consumption |
| Flywheel | High | High | Protect the loop that got you there |
Dead zone: nobody uses it and it loses money anyway
Low consumption, low gross profit per unit. You built it, no one came, and the handful who did cost you money. Most AI features shipped in 2024 so the company had something to announce ended up here.
There’s no clever pricing fix for this quadrant. Either the feature solves a real job and needs repositioning, or it doesn’t and should be switched off. Every month it stays on it carries infrastructure cost, support load and roadmap attention.
Token furnace: heavy usage, negative unit margin
High consumption, low or negative gross profit per unit. This is where most AI companies actually sit, and it’s the most dangerous quadrant because from the outside it looks like success. Usage charts go up and to the right. Board slides look great. Every transaction loses money.
Replit is the clearest public case. Its AI coding agents drove revenue from $300M to $525M ARR, while gross margin went from 36 percent to negative 14 percent across 2025. For a period, every dollar of revenue burned more than a dollar of compute.
GitHub Copilot ran the same play from the other end. Flat seat pricing at launch, reportedly losing money per developer on API costs, then a shift to usage-based billing in June 2026 that caught a lot of customers mid-cycle.
A furnace is survivable. It is not survivable at scale, which is exactly what growth does to it.
Boutique: healthy margin, no volume
High gross profit per unit, low consumption. The economics work, the business doesn’t scale.
Datadog holds gross margins above 80 percent at over $1B in revenue because it sells finished software rather than raw inference. Any AI feature priced well above its delivery cost behaves the same way. That’s a nicer problem than a furnace, but it’s still a problem. A boutique that never grows consumption is capped at whatever demand it already has.
Flywheel: usage and gross profit compound together
High consumption, high gross profit per unit. More usage, more profit, repeat.
Cursor reached roughly $1B ARR in 24 months at about $3.3M revenue per employee with almost no paid marketing. Lovable hit around $300M ARR with roughly 200 staff and no ad spend. Both run gross margins in the 50 to 60 percent range, nowhere near SaaS grade, and both compound anyway because the AI output does the distribution. Users share what the product generates and that brings the next user.
That’s the trade a flywheel makes. It accepts a lower margin percentage in exchange for gross profit dollars growing faster than costs. Note how little separates it from the furnace on the way in. Both spend heavily on inference. Only one gets paid back.
How to move up and to the right on the AI Profit Matrix
Two directions out, depending on which quadrant you’re starting from.
Getting out of the furnace
Three levers, in the order I’d pull them.
- Reprice onto the unit you burn. If your costs scale with tokens and your revenue scales with seats, you have a structural mismatch that no amount of efficiency work fixes. That’s the case for consumption based pricing, along with the problems that come with it.
- Cut cost per outcome, not cost per token. Route simple requests to smaller models. Cache aggressively. Measure the whole task rather than the call, because a cheap model that needs four retries is an expensive model.
- Add guardrails. Caps, quotas, effort-based tiers. Replit moved from flat per-run fees to effort-based agent pricing for exactly this reason. Cursor introduced usage limits after a customer hit a $7,225 bill and had to be refunded.
Getting out of the boutique
A boutique has a demand problem, not an economics problem, so product does more of the work here than pricing does. Make the output shareable so usage creates usage. Price for expansion rather than protection, which mostly means removing the caps and approval steps that teach people to ration a product you want them using more.
A boutique with real margin can afford to spend some of it buying consumption. Most don’t, because that margin looks so good sitting on the P&L.
Why raising prices often moves you left instead of up
The obvious fix for a furnace is to charge more. It works less often than you’d expect.
A price increase on a usage-heavy product suppresses usage. You end up with a better margin percentage on a smaller base, which is a move left across the matrix rather than up. You’ve turned a furnace into a boutique and called it a win.
What works is repricing rather than raising. Change what you charge for so revenue and cost move together, then raise the price on the metric that carries the value.
Conclusion
AI unit economics come down to two numbers: how much of your unit of delivery people consume, and how much gross profit each unit produces. Everything else on the dashboard sits downstream of those.
The companies that win the next few years will be the ones that moved up and to the right deliberately. They either scaled a boutique or fixed a furnace. Nobody drifts into the flywheel.
If you’re building an AI product and still reporting success purely in ARR terms, you’re flying with half the dashboard dark. Most of the pricing work I do at Potio starts here now, with SaaS and AI companies whose cost of delivery moves with every request.
Frequently asked questions
What are AI unit economics?
AI unit economics are the revenue and cost attached to a single unit of delivery, such as a token, an API call, an audio hour or a resolved support ticket. The two working numbers are consumption of that unit and gross profit per unit. They behave differently from SaaS unit economics because the cost of delivery is variable and moves with every request, rather than being a fixed hosting bill spread thin across all customers.
What gross margin should an AI company have?
Benchmarks put AI-native companies in the 50 to 65 percent range. Bessemer’s 2025 State of AI report cites roughly 65 percent median for LLM-first companies, ICONIQ’s 2026 data shows about 52 percent weighted average, and traditional software sits near 80 percent. Early-stage AI startups often run below 50 percent, sometimes negative, while they buy growth with subsidised inference. The absolute number matters less than the direction. A 55 percent margin improving quarter over quarter beats a 70 percent margin decaying.
Are there profitable AI businesses?
Yes, though profitable and scaling are two separate claims. Cursor reached around $1B ARR in 24 months at roughly $3.3M revenue per employee with almost no paid marketing. Lovable reached about $300M ARR with roughly 200 staff and no ad spend. Both operate at 50 to 60 percent gross margins. At the high-margin end, companies selling packaged software rather than raw inference keep SaaS-grade economics, which is how Datadog holds above 80 percent at over $1B in revenue. The common pattern is gross profit per unit rising as consumption rises.
Does the Rule of 40 still work for AI companies?
Not on its own. Rule of 40 adds revenue growth to profit margin and tells you whether you’re trading one for the other at an acceptable rate. In AI it flatters you, because growth is easy to buy with cheap inference and the margin damage lands a few quarters later. Two adjustments help. Use gross profit growth rather than revenue growth, and track gross profit per unit of consumption alongside the score. A company hitting 40 on revenue growth while its per-token gross profit falls isn’t passing the test, it’s postponing it.
How do AI companies make money if token prices keep falling?
By having costs fall faster than prices. A falling price is only a problem when your cost of delivery is fixed or falling more slowly. Anthropic’s inference margin reportedly rose from around 38 percent to over 70 percent during a period of price cuts. The real risk isn’t the price curve, it’s the consumption curve running against it. Agentic workloads use roughly 1,000 times the tokens of a simple query, so cost per outcome can climb while cost per token drops.
How do you calculate gross profit per token?
Revenue attributable to a unit minus the full cost of delivering it. The cost side is where most teams get it wrong. AI COGS includes inference spend, GPU hosting, vector database and embedding costs, retrieval infrastructure, observability tooling, data egress and any incremental support headcount created by AI features. You also need per-request logging that ties model, token count and customer or feature together, otherwise you get a total you can’t break down. The working rule from CFO practice is that if it hits recurring revenue, it hits gross margin.
Pricing consulting for
SaaS and AI companies.
I'm a 3x founder and former CEO of Toggl. I work hands-on with SaaS & AI teams to fix pricing, packaging and monetization.
Book a call